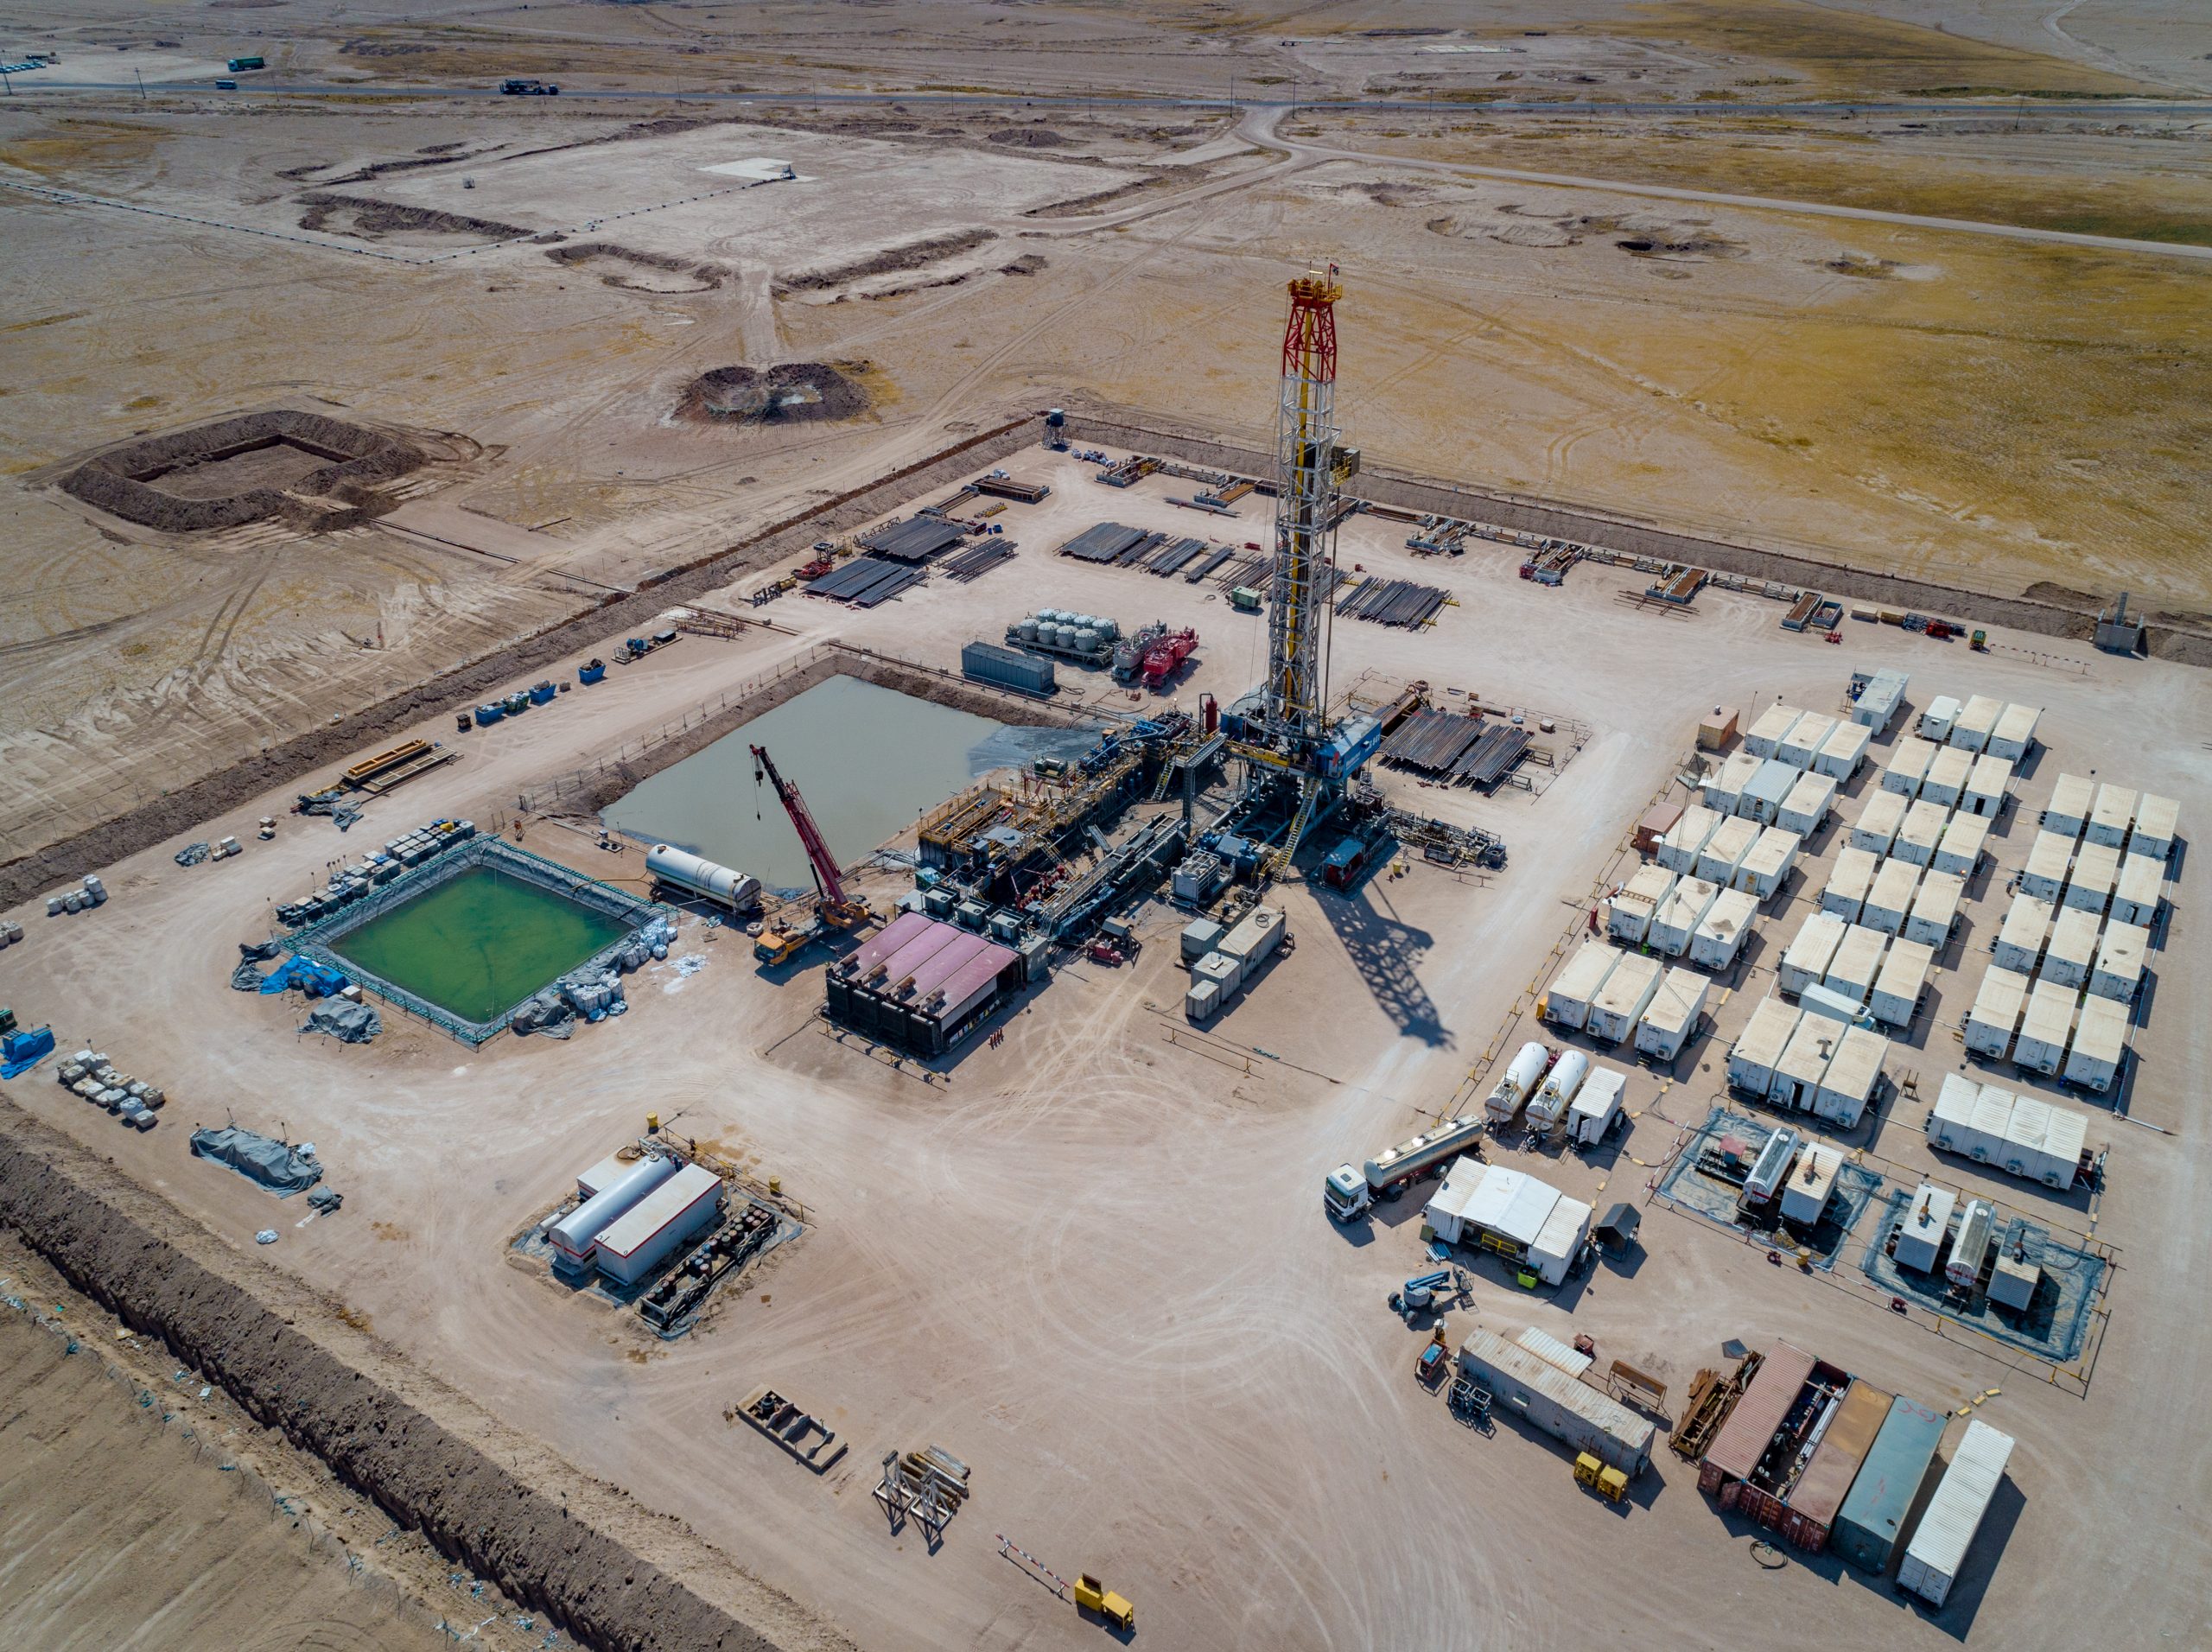
Rumaila’s production strategy is driven by the Subsurface Department’s understanding of the reservoirs. Developing cutting-edge technologies to enable this has been a priority since ROO was established in 2010.
SAT MAPS, used primarily by the Reservoir Management Team (RMT), is a vital part of the Subsurface Department’s enhanced digital toolbox, mapping reservoir fluids (oil and water) to help to optimize production in existing wells and locate new ones.
The tool draws on interpreted saturation log values, production logs and well tests for each Rumaila well and calculates fluid saturation, instantly. It displays an interactive map allowing users to select multiple wells and displays different data types in addition to fluid saturation such as oil and water production rates and other historic surveillance to assist the team’s analysis. The tool, which allows for immediate data integration, is also being used by the majority of RMT’s Iraqi staff. It has made the workflow much more accessible – what was once a specialist skill for only a handful of people has been opened up to all team members.
SAT MAPS has proven invaluable in helping reduce risk and uncertainty to inform subsurface decisions when identifying potential zones of remaining hydrocarbons (and reducing the chance of finding water) in existing wells and new well locations ultimately generating value for Rumaila.
James Lyne, RMT Senior Geologist, explained: “We have a thousand wells, multiple reservoir zones and run hundreds of surveillance jobs a year generating a vast number of data points to update and integrate. Manually checking and interpreting each of these data points to create a saturation map took three months and had to be updated annually. Reservoirs are dynamic (fluids move with production) meaning the maps need frequent updates to avoid making the wrong decisions, SAT MAPS was created to make this process much more efficient and interactive.”