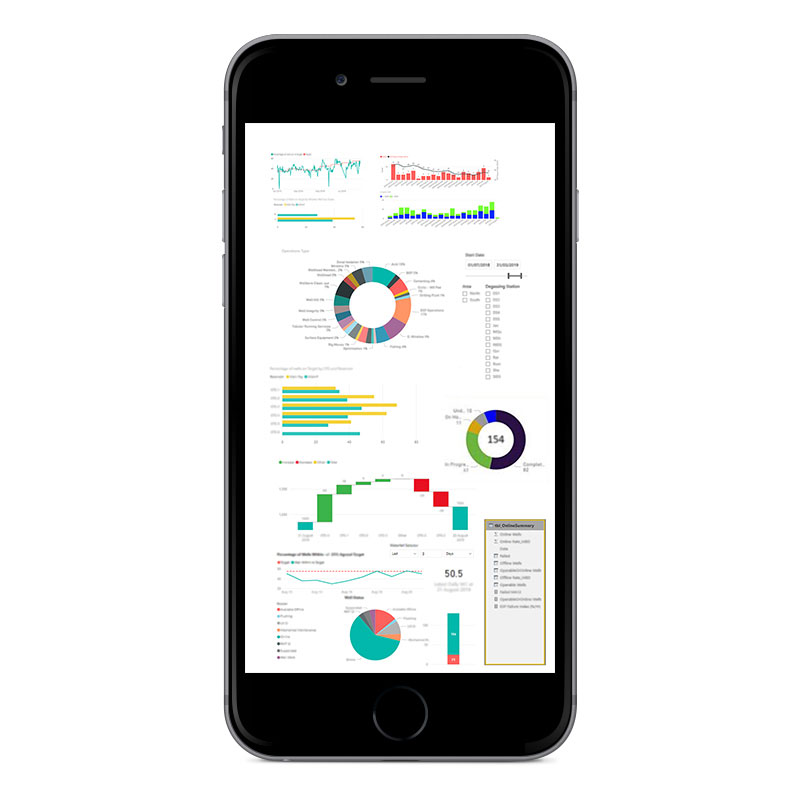
Power BI is a Microsoft application that can connect to almost any data source and produces visualizations in real time, and as it is web based, it can be accessed from anywhere, at any time.
Historically, every department at Rumaila used Excel spreadsheets and Access databases to analyse and capture data and PowerPoint to produce reports. Using this approach was repetitive and time-consuming, and also increased the risked of data errors.
Today, with the introduction of Power BI, every department has the ability to create its own reports using the application. Visualizing the data is now easy and the reports are dynamic compared to traditional Excel reports, with active filters and ‘drag and drop’ functionality. Users have access to the information, but the raw data remains protected. Power BI enables users to merge and append data from different sources to discover new correlations. This opens-up a whole new world of insight that might not have been obvious or achievable in the past. Sharing reports is now safer and more convenient, facilitating learning across the organization.
